


Setup and Optimize the National Instruments PXI-5441 Waveform Generator
Listen to this blog post here. The National Instruments PXI-5441 is a powerful PXI waveform generator designed...
October 25, 2024
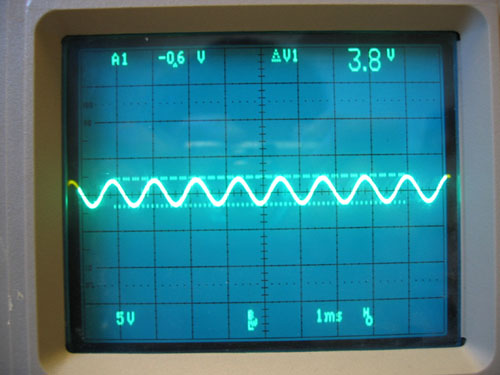






How many waveform shapes can you identify? In many popular movies and television shows, a sine wave displayed on an oscilloscope is a classic indicator that something “scientific” is happening. But what do these waveform shapes actually mean, and what do they represent? Let’s take a closer look at different types of waveforms, what they measure, and their value in test and measurement applications.
Waveforms are visual depictions of how electrical signals change over time. The vertical axis of the graph a waveform is on shows the signal’s amplitude, while the horizontal axis shows the interval of time. Waveform graphs also indicate the shape, frequency, rising time, and distortion.
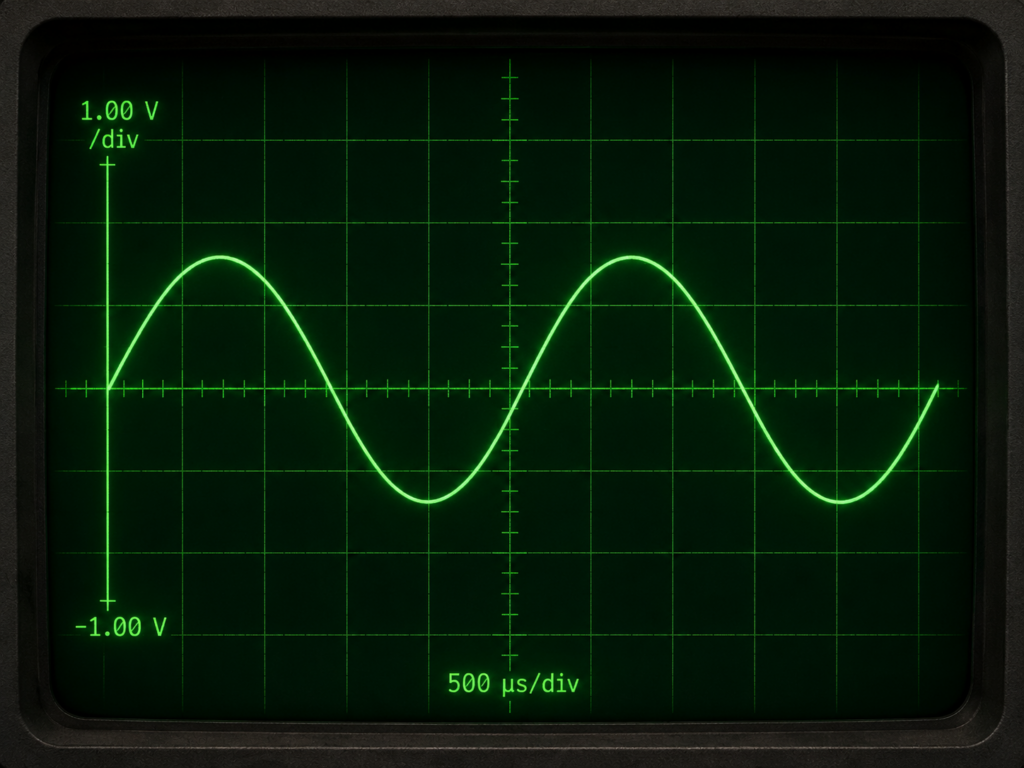
Sine Waves
Some of the most identifiable waveforms are sine waves. These waves are expressed mathematically by the function y = sin(x), which indicates that the wave continuously oscillates above and below 0 as it continues along the graph’s x-axis.
Sine waves are often produced as test signals by the oscillator circuit of a signal generator and by most alternating current (AC) power sources. These waves offer a “pure” measurement, meaning that they do not have to deal with additional harmonic frequencies.
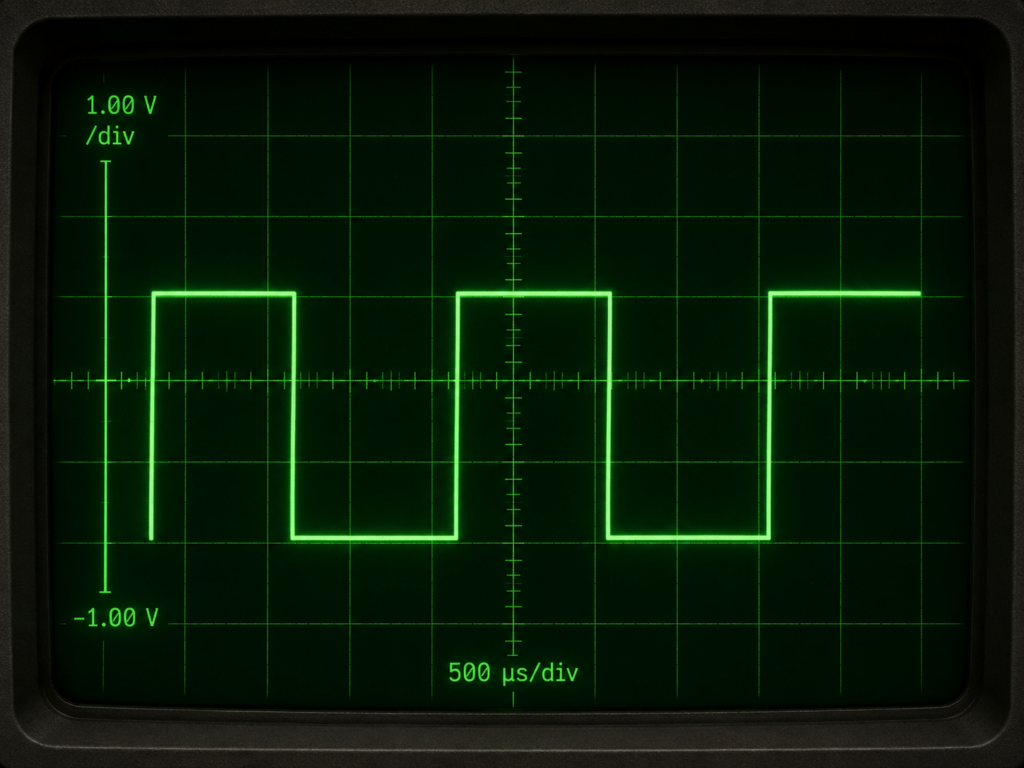
Square/Rectangle Waves
Another typical waveform is the square (or rectangle) wave, which indicates a voltage that alternates between “high” and “low” at regular intervals. This is determined by measuring one of two binary outcomes, either +1 or -1. If a good amplifier is used, the amplitude of a square wave can be increased with minimal distortion. The duration between the high and low points is what determines if this waveform is identified as a square or rectangle. These waves often encounter “odd” harmonics, which are the third, fifth, or seventh (etc) multiples of the frequency.
Square and rectangular waves are frequently used for measuring and analyzing the timing signals in electronic applications such as computers, radios, and televisions.
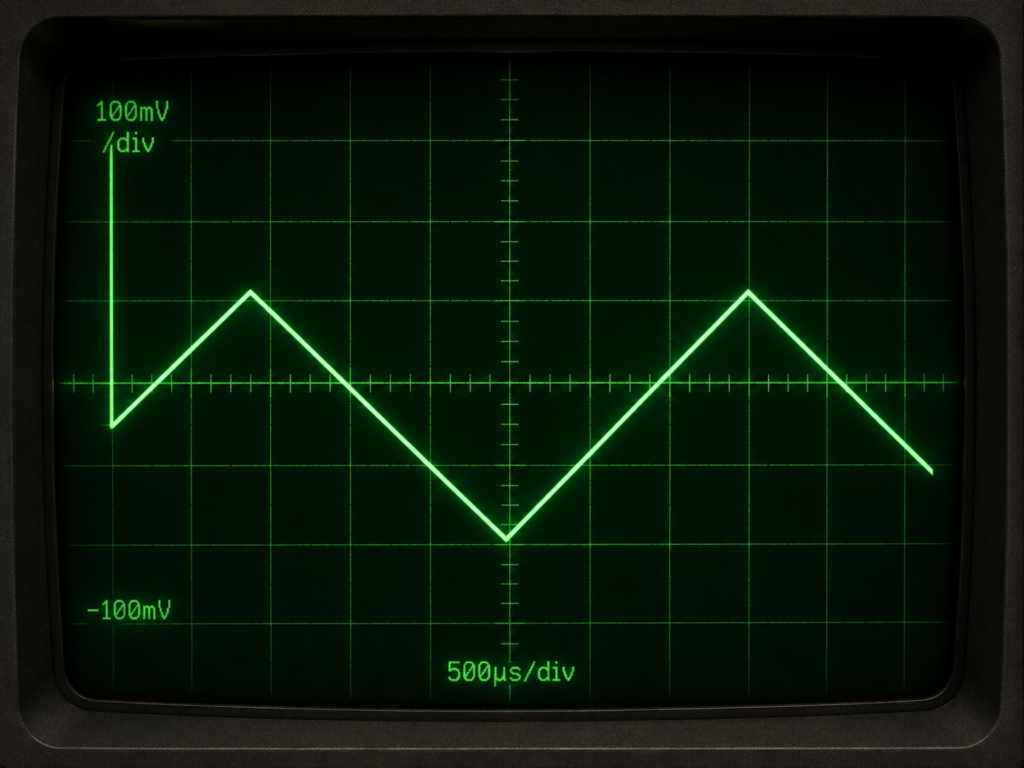
Triangle Waves
The triangle waveform shape is produced when voltage levels shift at a steady pace. These constant transitions between different voltage levels in circuits are referred to as ramps. Similar to square/rectangle waves, these waveforms deal with odd harmonics.
Triangle waves are formed by circuits that are designed to regulate voltages linearly, such as the horizontal sweep of an analog oscilloscope.
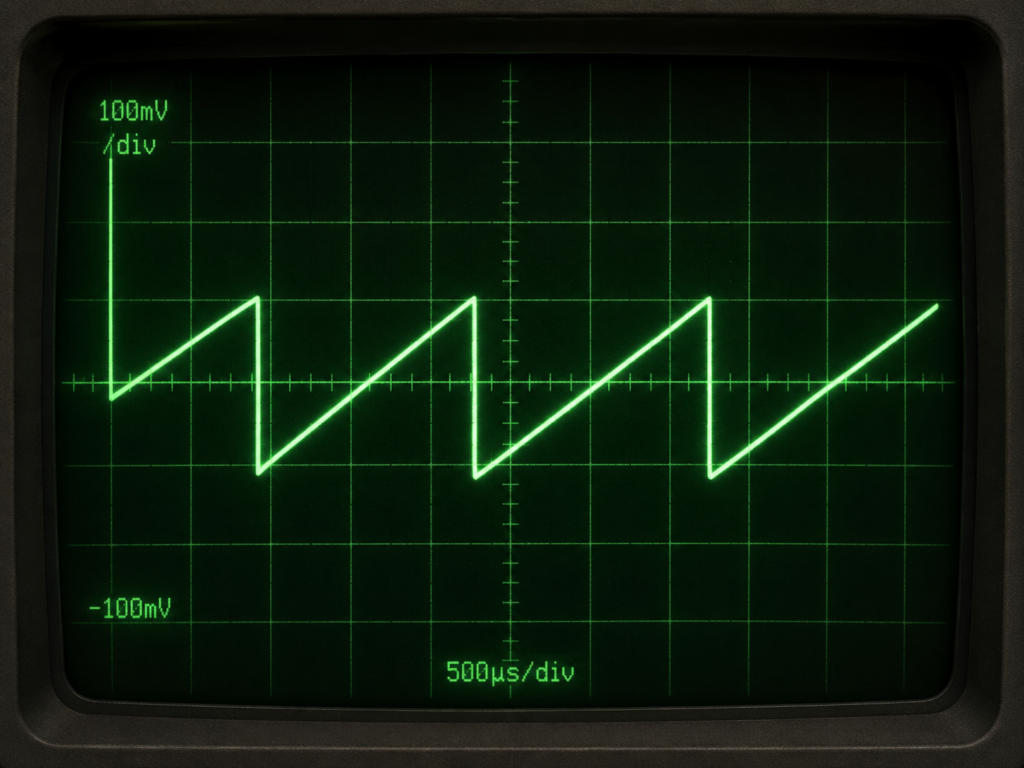
Sawtooth Waves
Sawtooth waveforms are very similar to triangle waves in the way they undergo constant variations in voltage levels. However, they are also very similar to square waves in the way that the ramp is followed by a sharp drop. These waveforms experience harmonics from multiple frequencies.
This waveform shape is a result of when a capacitor is charged with a continuous current source, or if a capacitor shorts out and then discharges abruptly.
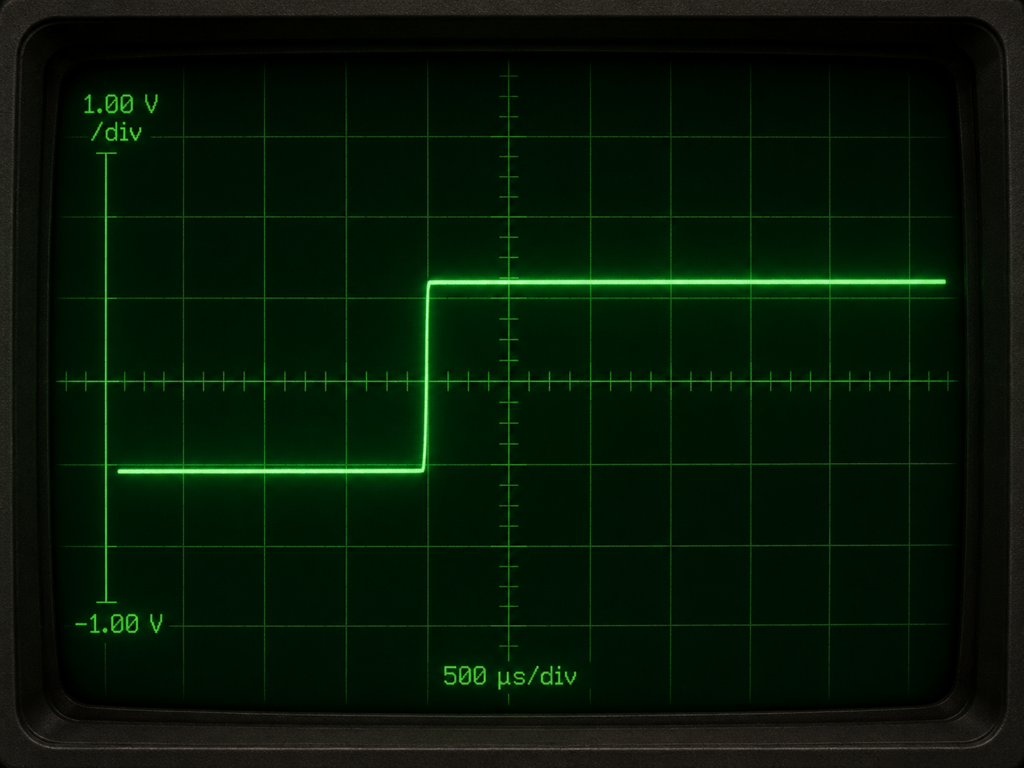
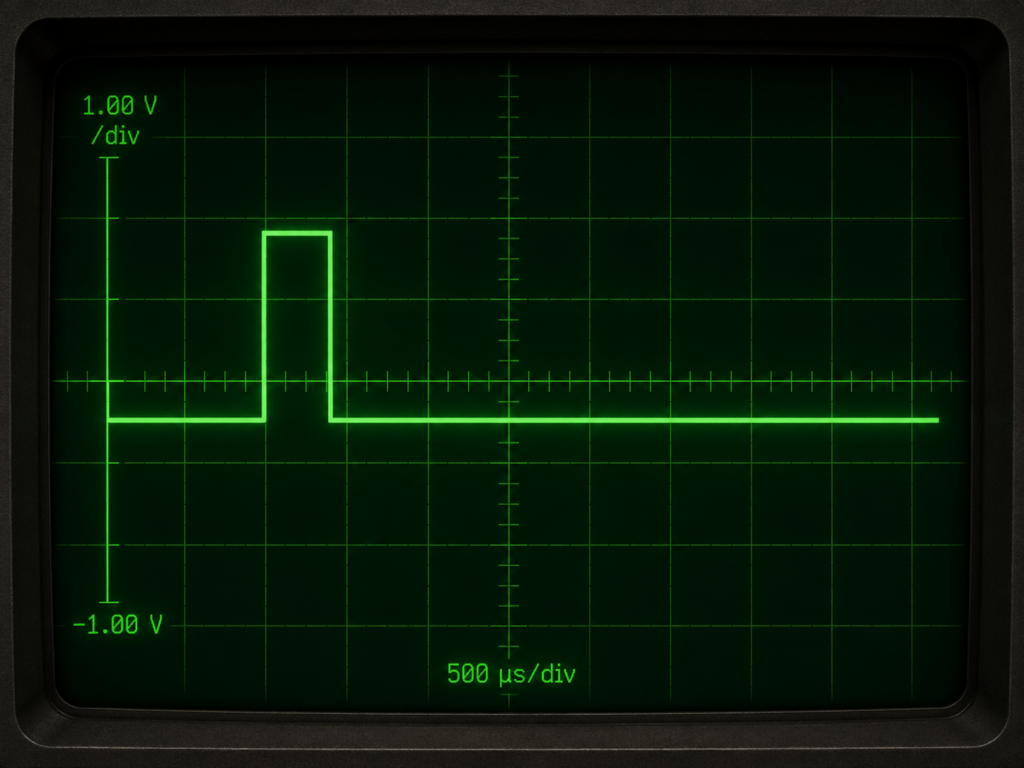
Step and Pulse Waves
Step and pulse waveforms are commonly associated with signals that occur infrequently or irregularly. A step indicates an abrupt change in voltage, similar to when a power switch is turned on. On the other hand, a pulse indicates abrupt variations in voltage, as when that power switch were to be turned on and then off again.
Pulses are often found in digital applications such as computer circuits, telecommunication, X-rays, and radars. A sequence of multiple pulses moving in unison is known as a pulse train.
The two main types of oscilloscopes used in test and measurement applications are analog and digital. The technicalities behind how they display waveforms differ depending on which type of oscilloscope you are using.
In analog oscilloscopes, which use cathode-ray tube (CRT) displays, the waveform appears when an electron beam makes the phosphor coating inside of the screen glow. This beam sweeps over the screen horizontally in time with the input signal, resulting in a display that is continuously updated in real time.
For digital oscilloscopes, the waveform data is initially recorded and stored before being processed for the LCD or LED panel. Digital displays have increased analytical capabilities, including panning, zooming, and performing mathematical operations.
Some of the most common measurements include:
Frequency and Period
A signal’s frequency is the number of times it repeats per second (if it repeats continuously). This measurement is expressed in hertz (Hz). The period of a signal is inversely proportional to its frequency, meaning that it measures the duration of one complete cycle of the repeating signal.
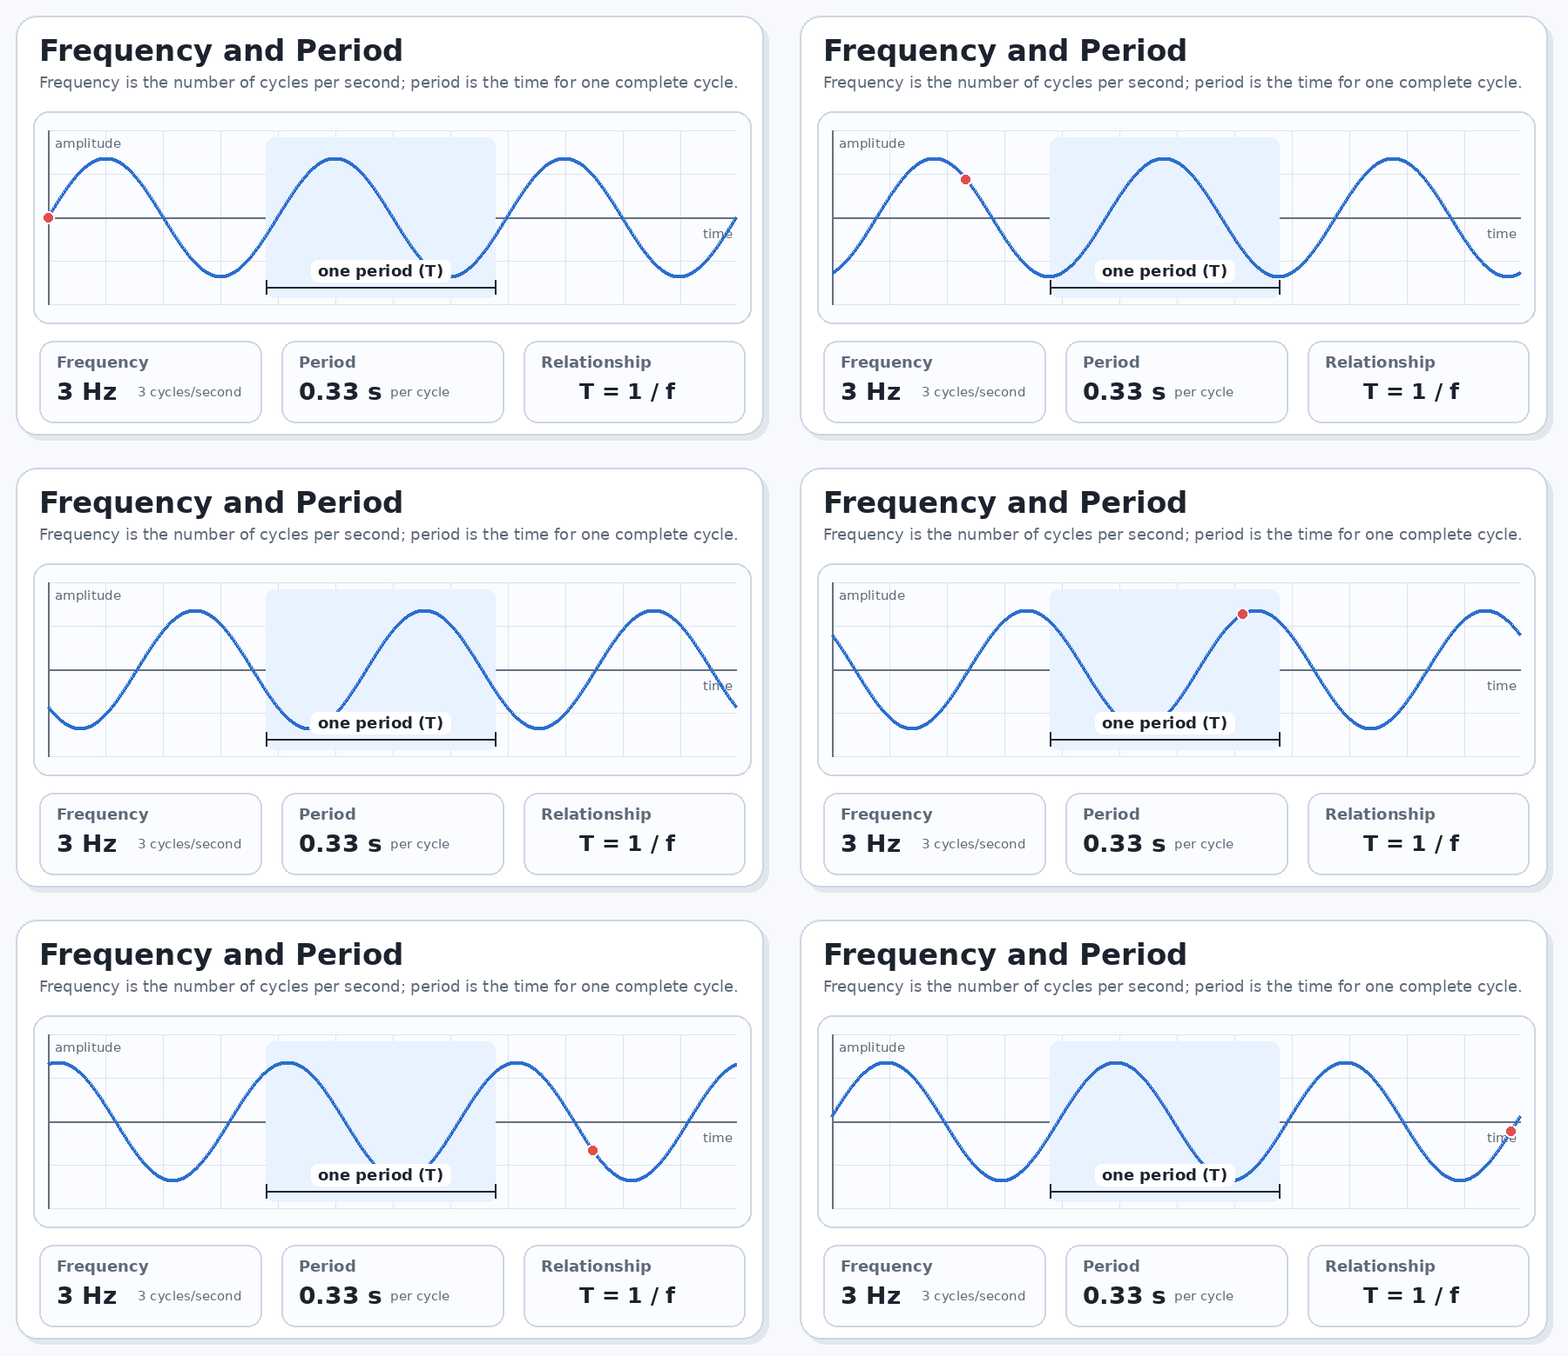
The formula for calculating frequency (f) is f = 1/T.
The inverse of that formula, used for calculating period (T), is T = 1/f.
Voltage
The voltage of a signal measures how much signal strength is found between two points in a circuit. Typically, one of these points is measured at 0 volts (also known as “ground”), but that is not always the case. The measurement between the highest and lowest peaks on a waveform is known as “peak-to-peak” voltage.
Amplitude
The amplitude is the difference in voltage between the ground and the maximum voltage.
Phase/Phase Shift
The phase of a waveform measures the present location of the wave relative to a specific reference point. Phases are measured in degrees, with one wavelength being equal to 360 degrees. Differences in time or position between two otherwise similar signals are referred to as phase shifts.
Rise and Fall Times
The rise or fall time of an electrical signal is the measure of change from a low state to a high state (or from high to low). More specifically, rise or fall times commonly track how much time is needed for a signal to increase from 10% to 90% of the max amplitude (or decrease from 90% to 10%).
Oscilloscopes are not the only test and measurement equipment that deal with waveforms, but how can you know which one to pick for your specific test setup? Below is a simplified reference guide to picking hardware for your application.
As the name implies, waveform generators are capable of creating signals, not just measuring them. These tools are best when you need to create a specific test signal for a device to see how it responds. Common types of waveform generators include function generators, arbitrary waveform generators, and pulse generators.
Oscilloscopes are an excellent choice when you are working with time-domain behavior and need to quickly view, troubleshoot, or measure a signal. These are best suited for applications that require high-speed acquisitions.
Digitizers have a lot of technical overlap with oscilloscopes and can even operate as one when paired with a compatible display and controls. In general, digitizers are more geared towards acquiring, converting, and processing raw time-domain data as opposed to viewing or troubleshooting the waveform.
Spectrum analyzers are a good choice when your application needs to identify and measure specific frequencies found within a signal. They are especially useful when dealing with RF analysis, harmonic detection, or noise measurements.
Still not sure which part is right for your application? Reach out to us today at support@apexwaves.com! We will be glad to help you troubleshoot your setup and find the exact part you need. With thousands of parts in stock and ready to ship, we can get your hardware delivered to you as quickly as possible.
LEARN MORE
A monthly email packed with valuable content—industry news, tutorials, obsolescence updates, and more. No sales pitches, just insights we think you'll find helpful!
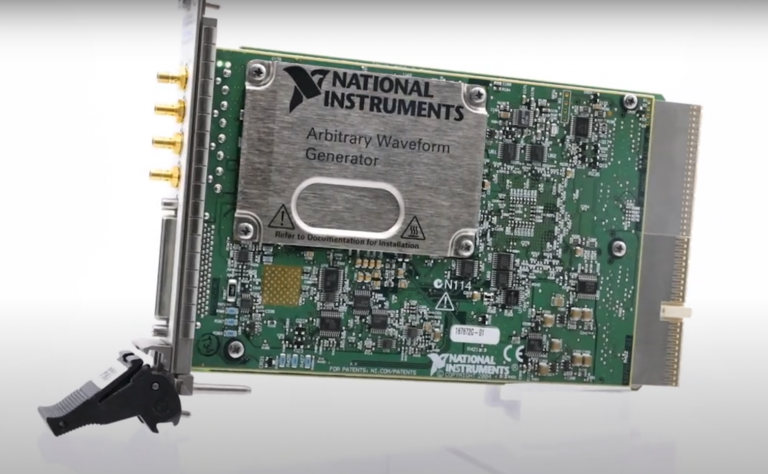
Listen to this blog post here. The National Instruments PXI-5441 is a powerful PXI waveform generator designed...
Click here to listen to this post. Companies in almost every industry are being transformed...
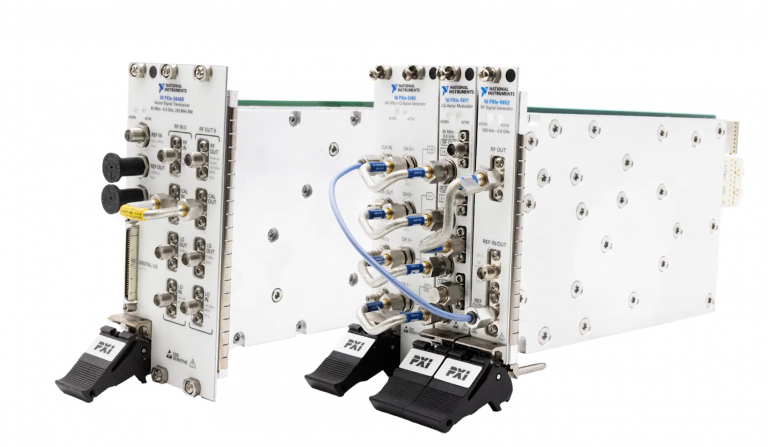
Listen to this post here. The PXIe Platform from National Instruments offers an incredibly valuable toolset for...

Click here to listen to this post instead. It is no secret that simulation and...