Understanding TTL Triggers in Oscilloscopes

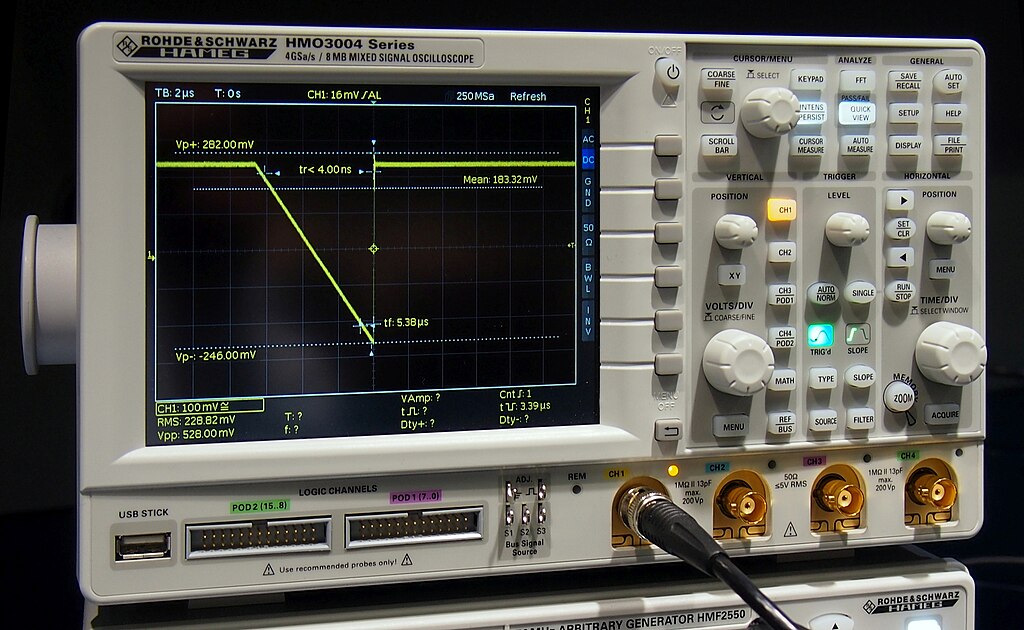
Rohde and Schwarz Hameg Oscilloscope

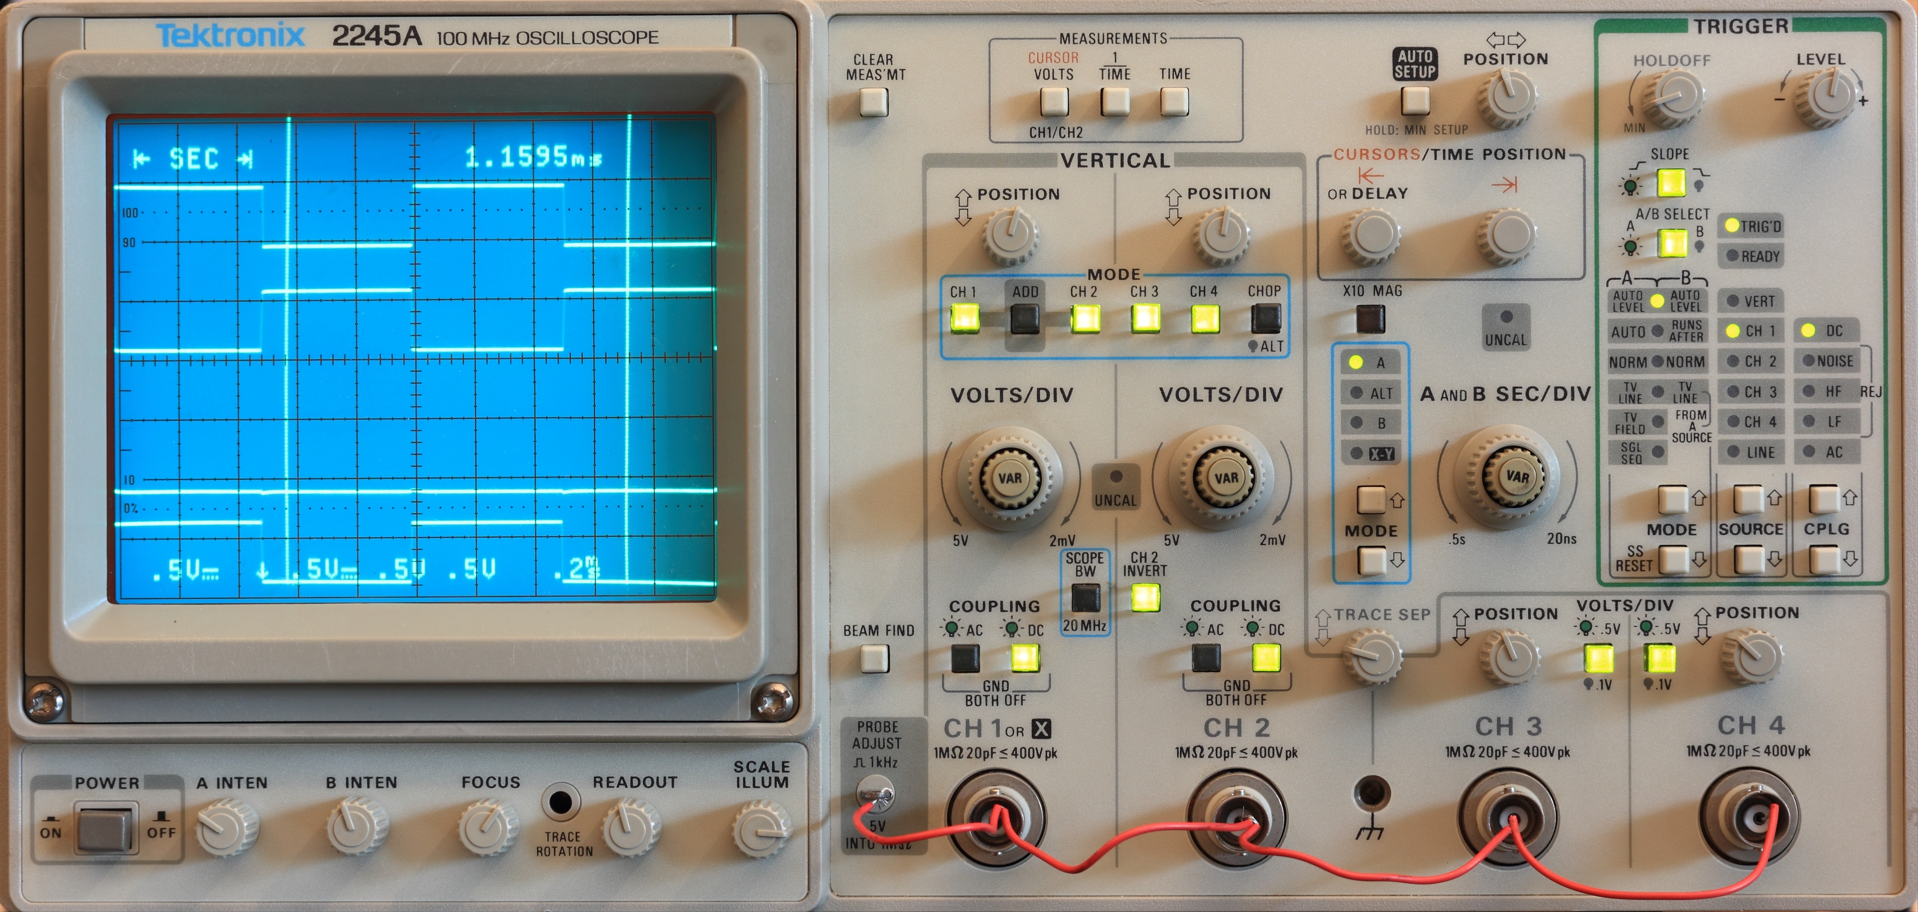
Oscilloscopes are indispensable tools in the world of electronics. They allow engineers and technicians to visualize and analyze electrical signals, providing valuable insights into circuit behavior. One crucial feature that enhances the utility of oscilloscopes is the trigger function. Among the various trigger options available, TTL triggers play a significant role in capturing and analyzing digital signals.

Continue reading “Understanding TTL Triggers in Oscilloscopes”

Calculating Average Values for Different Waveforms

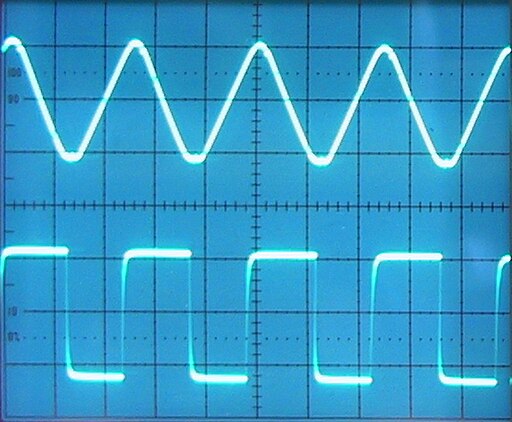
Closeup cropped picture of a triangle wave and square wave on a blue oscilloscope screen

In the realm of engineering and signal analysis, understanding waveforms and how to calculate them is critical. Waveforms come in various shapes and sizes, each carrying its unique characteristics. To gain a deeper insight into these signals, engineers often employ the concept of average value. This value provides a measure of the signal’s intensity or strength. In this post, we’ll dive into the variety of formulas for finding the average values for various waveforms.

Continue reading “Calculating Average Values for Different Waveforms”

A Quick Guide to Waveform Shapes and Measurements

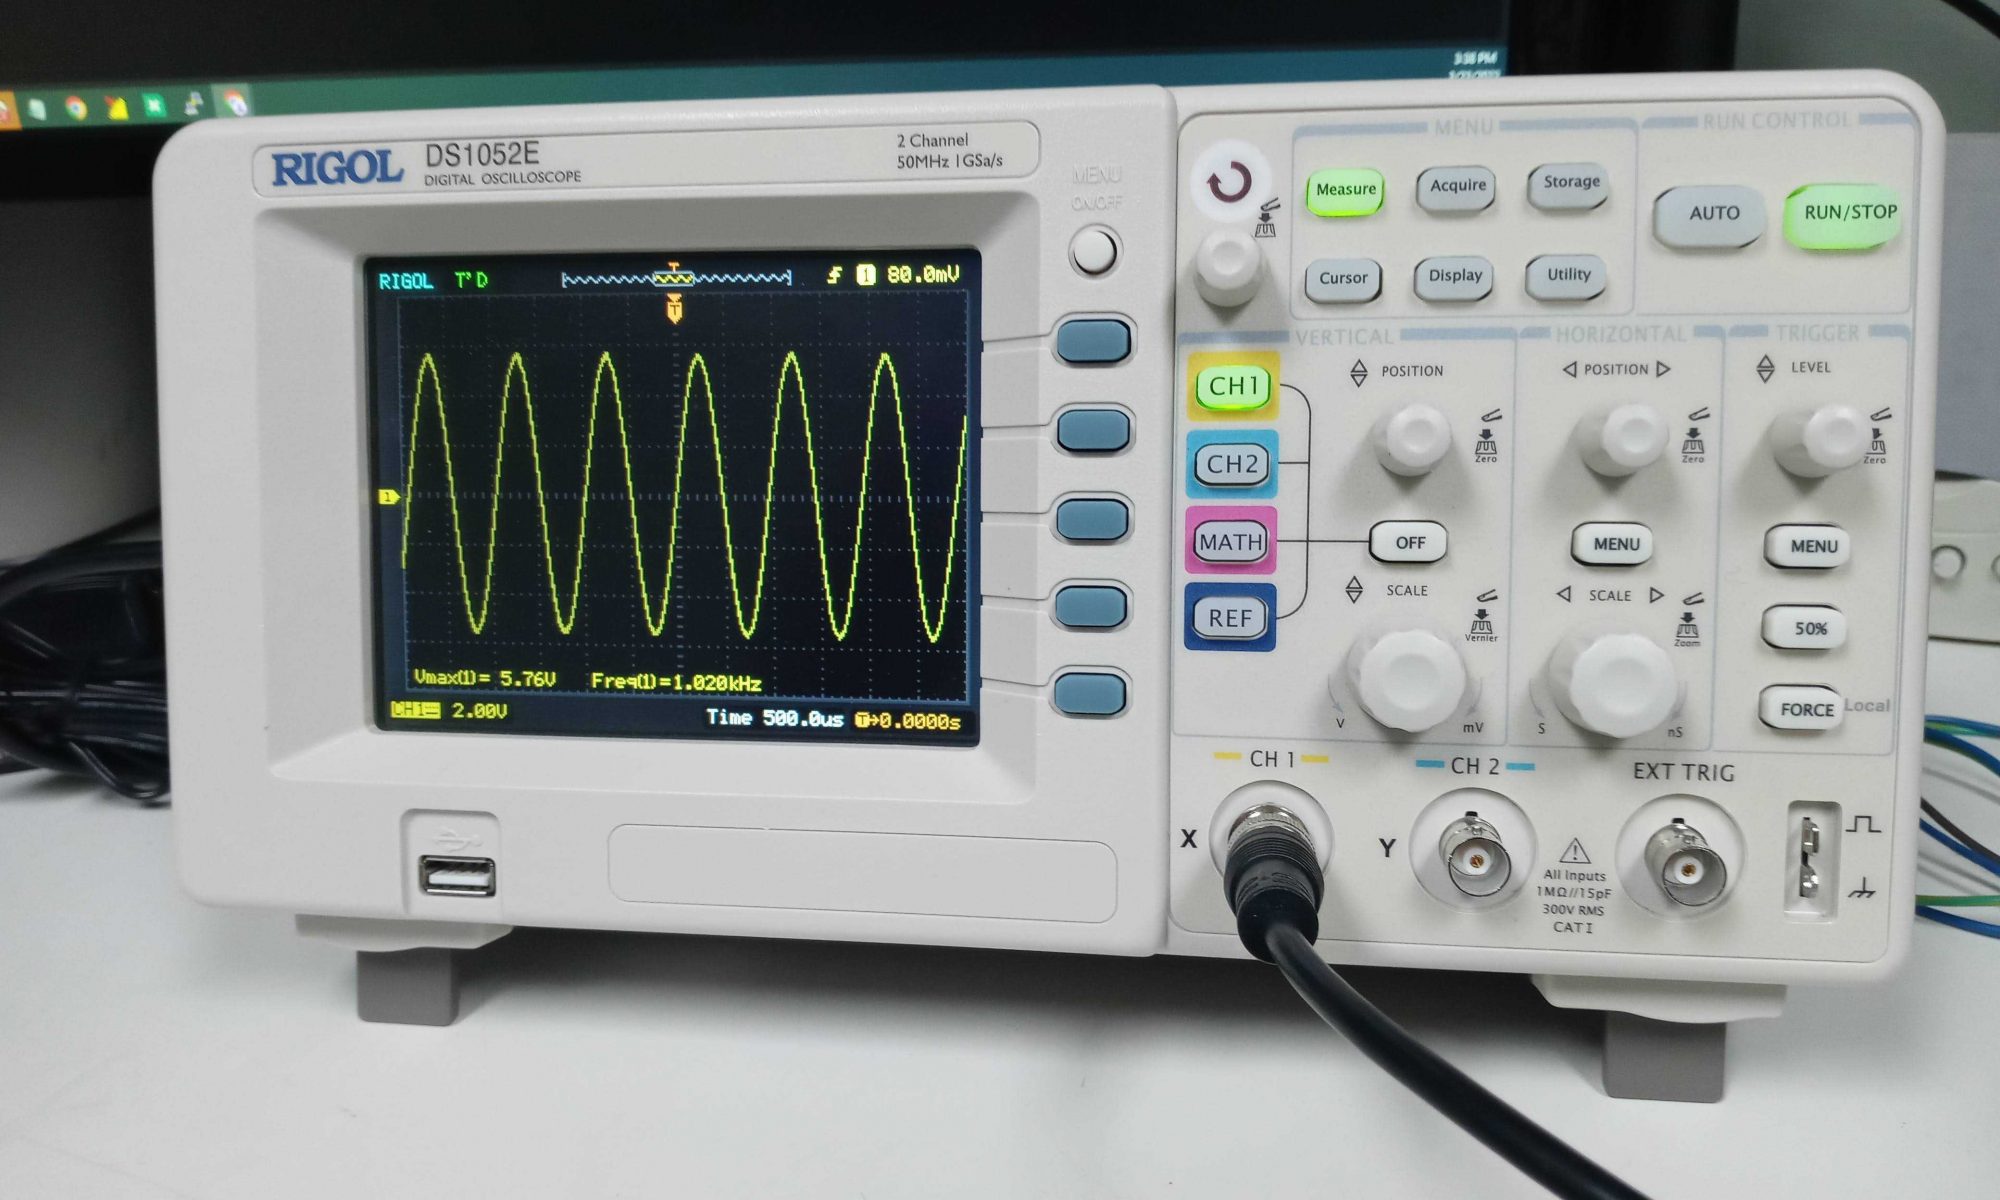
Closeup of Rigol oscilloscope displaying a sine wave

Waveforms play a vital role in ensuring the dependability, precision, and efficiency of test and measurement systems and devices. The waveforms displayed on the graph screen of an oscilloscope provide a convenient visualization for critical information about the signals under test, such as their properties, performance, and behavior. This post will serve as a quick and convenient guide to the importance of waveforms, some common shapes, and different types of measurements!

Continue reading “A Quick Guide to Waveform Shapes and Measurements”

Why Visualization of Signal? Basics to Understanding Oscilloscopes

The specific characteristics of a signal can be measured by a variety of instruments. For example, a counter can measure a signal’s frequency or its period, and an ac voltmeter can measure the RMS value of the signal. Although these instruments are very useful and can be more accurate than the oscilloscope, their application is mainly limited to the measure­ment of one parameter of the signal. With an oscilloscope, one can visual­ize the signal of interest and also observe whether the signal contains properties that would not be made apparent by most other instruments (for example, whether the signal is superimposed on a de level, or whether there are noise or relative hf oscillations present with the signal at the test point). Thus the oscilloscope is a more valuable instrument because it gives an exact visual representation of the signal waveform.

Continue reading “Why Visualization of Signal? Basics to Understanding Oscilloscopes”

Sampling Oscilloscopes

Sampling is the taking of a specimen, or a part, to illustrate the whole. For example, when a ship’s cargo of sugar must be checked for the amount (%) of water in the sugar, specimens of the sugar are taken from various places in the ship. The more specimens are taken, the more information is available about the quality of the cargo overall. It is evident that to be 100% sure about the condition of the cargo, all the sugar present in the ship would have to be checked; however, this is not possible.

Continue reading “Sampling Oscilloscopes”

Understanding Specifications Part 2

To prevent interference on receiving apparatus, for example, audio and TV receivers or computer systems, signals generated in the line supply and the radiated electromagnetic field of radio frequency from electrical equipment may not exceed certain limits. For this, the IEC makes recommendations. A special committee of the IEC, the CISPR (International Special Committee on Radio Interference), has published several definitions concerning measuring sets and measurement procedures for the various types of interference-producing equipment.

Continue reading “Understanding Specifications Part 2”

Understanding Specifications

The 15-MHz portable dual-trace oscilloscope Philips PM 3226 is a compact, lightweight instrument featuring simplicity of operation, for a wide range of use in servicing, research, and educational applications. Other features include provision for chopped or alternate display of Y signals, automatic triggering, mains triggering, and triggering on the line and frame sync pulses of a television signal. The cathode-ray tube displays a useful screen area calibrated into 8 x 10 divisions by an external graticule.

Continue reading “Understanding Specifications”

Measurement Pitfalls

Very often hum is present on the signals under test. This can be easily determined from the screen because the hum is related to the line frequency. If a signal shows a kind of unexpected amplitude modulation, switching back the time-base setting to about 5 to 10 or 20 ms/div, and switching over the trigger source selector to MAINS (or LINE), will generally result in a stable picture in the event of hum.

Continue reading “Measurement Pitfalls”