The specific characteristics of a signal can be measured by a variety of instruments. For example, a counter can measure a signal’s frequency or its period, and an ac voltmeter can measure the RMS value of the signal. Although these instruments are very useful and can be more accurate than the oscilloscope, their application is mainly limited to the measurement of one parameter of the signal. With an oscilloscope, one can visualize the signal of interest and also observe whether the signal contains properties that would not be made apparent by most other instruments (for example, whether the signal is superimposed on a de level, or whether there are noise or relative hf oscillations present with the signal at the test point). Thus the oscilloscope is a more valuable instrument because it gives an exact visual representation of the signal waveform.
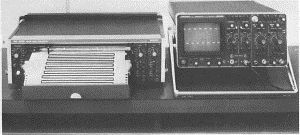
Figure 1.1
Figure 1.1 shows a chart recorder drawing a graph of a signal as a function of time. Of course, the recorder can only create a replica of the signal if the pen follows the excursions of the signal exactly and if the paper moves at a constant speed. The oscilloscope works in a similar way: The spot follows the excursions of the signal in the vertical di rection and at the same time the spot is moved in the horizontal direction at a constant speed. The graph on the recorder is distorted when the paper speed does not remain constant. In the same way, the display on the oscilloscope is distorted when the ramp voltage-a voltage that in creases linearly with time-is not perfectly linear. At this point, the similarity between the recorder and the oscilloscope ceases.
The recorder will draw a graph as long as the paper is being transported along the pen system. In the oscilloscope, we have one screen on which a part of the signal is written during a certain time span. In order to obtain a stable picture, the oscilloscope will draw a great many of those parts of the signal, one part after the other and each one covering the previous one exactly. Thus the eye observes one steady picture of the waveform. It is assumed here that the signal is repetitive in time. The method of obtaining a steady picture is discussed later in this chapter.
There is a much bigger distinction between the chart recorder and the oscilloscope, however. The writing system of the recorder has a certain mass, whereas the picture on the oscilloscope screen is written with a beam of electrons that are virtually massless. Therefore, the speed of the recorder system is limited to a few transients per second, while the electron beam can visualize transients in the nanosecond (l Q- 9 second) area. The oscilloscope is thus able to visualize much faster phenomena than the recorder, and it is primarily for this reason that the oscilloscope is as widely used as it is today.